The City of Tallinn required mobility data in order to plan several developments in the outer areas of one of its districts, North Tallinn. Based on mobile positioning data, Positium mapped the entire network of mobility between the sub districts and travel to work outside the districts. Mobile positioning data provided a look of the whole city over an extended period of time, previously not available or hard to get.
The results: the data was successfully incorporated into a resulting mobility study and analysis that laid the foundation for new urban development planning.
North Tallinn: A Connected City District Undergoing Change
The goal of urban planning is to create a liveable city space that supports the everyday activities and mobility of its people in the best way possible. North Tallinn was planning several developments in the outer areas of its district that were destined to become new business, industrial and residential districts.
With the existing access routes already under stress during rush hours, Tallinn Urban Planning Department looked to data to understand current movement patterns.
The object of the North Tallinn Mobility Study of 2014 was to analyse the movements of the residents and workers of the district in order to efficiently plan future connections to new urban developments.
There are multiple ways to determine the numbers of people moving from place to place, including surveys and traffic counting. All the options were also present in the bidding process. The Urban Planning Department chose mobile positioning as the preferred choice, because it was the best fit considering the time frame and the scope.
This is the only relevant method to get data to describe mobility between various points.
- Jaak Adam Looveer - Tallinn Urban Planning Department
Mobile Positioning Data Analysis Provides Timely Results
Mobile positioning data offered a few important benefits over traditional data sources, which led the City of Tallinn to choose it as the preferred option. The three most important benefits they considered were:
- Mobile data is inclusive, describing the movements of a very large sample of various demographics and across other districts and satellite towns of Tallinn.
- It is significantly faster, shedding 85% on the time to results (See a comparison below).
- It describes the full extent of actual movements as determined by behaviour, rather than the memory of respondents
Decision: Survey or Mobile Positioning Data? | |
|
Estimated time spent for a year-long survey: |
Time it took to produce mobility data with mobile positioning data (1 year): |
|
Survey design: 1 month
Survey period: 12 months Processing and analysis: 2 months
| Data collection (has already taken place passively within the operator): 0 months |
|
TOTAL: 14 months |
TOTAL: 2 months |
An Understanding of the Activity Spaces of Its People
To develop an understanding of the activity spaces of its people, the city district of Northern Tallinn needed to know how people move.- Location of places of work and home
- Snapshots in time of people in the district during a defined time period
- Movement between work and home within the district, to and from other districts
and neighbouring municipalities
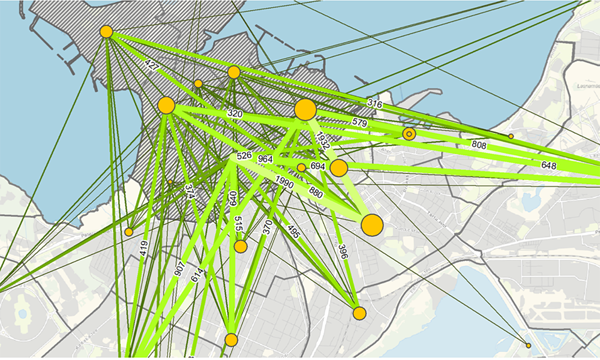
Figure 2. Number of people commuting to work every day outside the district of North Tallinn (lines indicate the number, whereas the size of the bubble outside the district denotes number of workplaces in the destination zone). The same can be represented in an origin-destination matrix format.
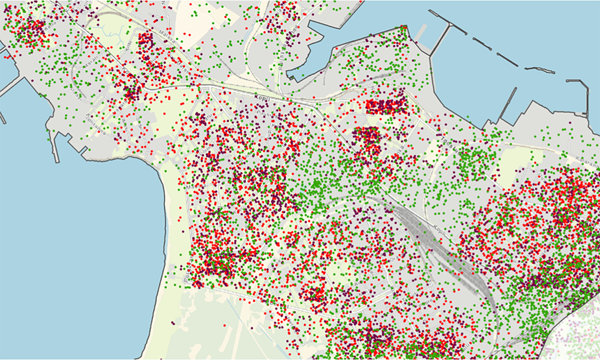
The end result was a spatio-temporal picture of commuting and recreational trips.Positium analysed millions of location data points in CDR and IPDR datasets from one mobile network operator to produce anchor points for people and analysed movements between those points. The observed data period ran from November, 2012 up to October, 2013.
The anchor point method by Positium enables to calculate home and work-time place, and distinguish movements between those places by temporal and spatial pattern of the anonymous user. The algorithms to detect home locations and usual environment have been developed through cooperation with University of Tartu in Estonia.It was extremely important that we could determine the areas, measure distances, distinguish shorter and longer travels. We saw mobility between smaller units, and their focal points.
- Jaak Adam Looveer - Tallinn Urban Planning Department
Data accuracy is improved by observing extended time periods and using geographical probability distribution methods. Statistical methods are used to estimate one operator’s data to the general population.
The Data More Than Fulfilled the Expectations
The time frame and geographical scope of the data exceeded what was previously thought was possible by Urban Planning Department. The data was successfully incorporated into a resulting mobility study and analysis that laid the foundation for new urban development planning.
The observable time scope allowed through mobile data (12 months) was much more
extensive than that of surveys (8 days) or traffic counters (7 days). In addition, it allowed
to distinguish weekend movements and seasonal differences, based on behavioural data, rather than
recollections.
The sample for which mobile positioning data was available was roughly 35% of the district’s population, compared to 1% (35x difference) that was captured through surveys. At the same time, mobile data also captured workers from all over Tallinn and satellite districts, at least doubling the sample size.
To determine the actual destinations of people moving into and out of the district, surveys have to have very huge samples, whereas traffic counters cannot provide data on destinations. Mobile positioning data included the entire area of Tallinn and satellite areas into the geographical scope of study, giving unprecedented data with excellent quality.
Lastly, in terms of the cost of services, even though the resulting dataset provided more
than the client expected, it was cost effective compared to both an extensive traffic
counter study and surveys. The combination of mobile positioning data and a small survey
proved to save money for the Urban Planning Department compared to merely relying on
traditional solutions.
Would you be interested in learning more about mobile big data and Positium? Let's talk about what mobile big data can do to help your organisation make decisions based on population mobility.
.png)

