Why Should National Statistical Offices Run a COVID-19 Big Data Project?
Why should it be a national statistics office who runs a big data project? They do not have the data in question or the expertise on big data processing. Furthermore, national statistical offices are often perceived as low on budget and under-staffed.
But national statistical offices (NSOs) also have multiple strengths that are vital in these kinds of situations. They are the go-to organisation for producing statistics needed for government decision-making. They champion data quality and maintain the fundamental principles of statistics, creating statistics you can trust. And they are also mandated to access data of private companies for statistical purposes in Estonia.
Estonian COVID-19 Analysis
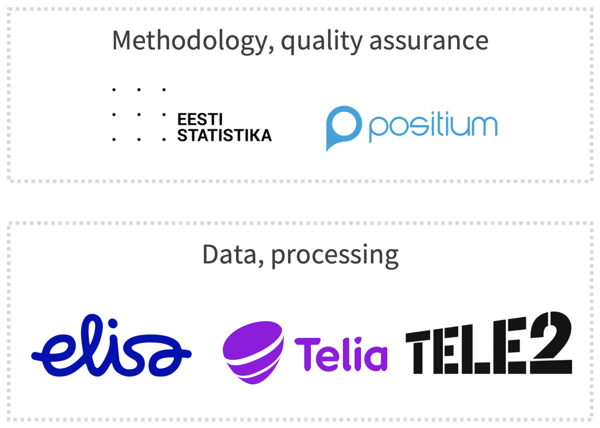
The above points became ever relevant as the work started, especially in order to get the approvals to go ahead. Statistics Estonia and Positium quickly developed the methodology to assess the mobility of people in Estonia.
Next, the terms of reference were negotiated between three mobile network operators (Telia, Elisa, and Tele2), the Estonian Association of Information Technology and Telecommunications, the Government Crisis Committee, the Data Protection Inspectorate, the Ministry of Economic Affairs and Communications, and the Chancellor of Justice. The MNOs reacted quickly to the request. They knew their data well and were able to move fast with the implementation of the method and data transfer.
The initial project used data from 20 February to 17 May 2020, to compare mobility during the state of emergency and the period preceding it. The emergency situation started on 13 March and ended on 17 May. The project was repeated a year later, during another pandemic wave. The second phase ran from 20 February to 31 May 2021.
For each anonymised mobile number, a primary location was calculated. For this, antennas to which the number was connected to for the majority of the time during the previous 24 hrs were identified. Both the average as well maximum distance travelled were taken into account.
Anonymised phone numbers were divided into three categories – completely sedentary and phones with little mobility, i.e 95% sedentary mobiles. In those cases, the phone remains in its area either at all times or at least 95% of the time (stays outside of the area for up to 72 minutes a day). The other class was mobile phones which were outside their primary location at least 5% of the time or 72 minutes a day.
The results were aggregated to county and municipality levels. The government got more detailed information.
Dashboard
To visualise the results and make them more understandable, Positium developed an interactive map-based dashboard in only two weeks. The dashboard combined data from all three operators and was updated daily. It showed the percentage of sedentary mobile phones, which reflected how well people were obeying mobility restrictions. The system provided live updates to the Prime Minister’s and Crisis Committee’s offices.
The public dashboard played a crucial role in crisis communication and helped gain public trust. In order to protect the privacy of data subjects, the data was updated only until a previously agreed date.
On the public dashboard, users could choose between county and municipality levels and different days. Clicking on an administrative unit on the map revealed a pop-up showing the percentage of sedentary phones in that administrative unit and the whole country in 2020 and 2021, and the 14-day cumulative number of cases per 100,000 people. The next tabs allowed comparing the percentage of sedentary phones in a chosen area unit to the corresponding share in other units and the whole country.
You can read about the dashboard in the news release published on Statistics Estonia's website.
Short Demo
What Did the Data Tell Us?
After the state of emergency was declared on 13 March 2020, mobility decreased rapidly in the country and stayed low until the beginning of April. It was also clear that people obeyed the mobility restrictions more at the beginning of the lockdown than at the end. The most sedentary day was Easter when approximately two-thirds of the entire population remained in its primary location at least 95% of the time. In April, mobility started to increase, and was especially high during weekends with nice sunny weather.
The population present in the two biggest cities – Tallinn and Tartu – decreased after the state of emergency was declared. Most smaller municipalities, on the other hand, gained population during the period observed. This shows that many residents of Tallinn and Tartu decided to stay at their summer homes or somewhere else outside the city during the mobility restrictions.
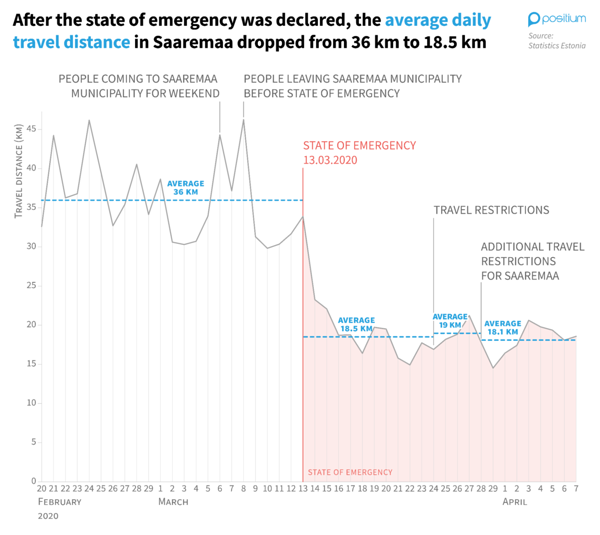
During the first wave of COVID-19, the island of Saaremaa was hit unproportionally hard and the government imposed the strictest mobility restrictions there. Before the state of emergency, people would go to Saaremaa for weekends, causing an M-shaped mobility trend. After the emergency was declared, visits to the island were no longer possible. The average travel distance dropped from 36 km to 18.5 km on the island.
Use of Analytics Tools Based on MPD During COVID-19
The use of mobile positioning data to analyse people’s mobility during COVID-19 emergency proved to be crucial for decision and policy makers, not only in Estonia, but other countries as well.
The 2021 report entitled “Utilising mobile big data and AI to benefit society: Insights from the Covid-19 response” published by GSMA , an organisation that unites more than 750 operators, highlights how analytics products based on processing MPD can help inform critical decisions, shape intervention plans and assess the impact of actions, whilst respecting data privacy. The report presented implementations from over 40 countries, and set forward recommendations based upon detailed case studies, and outlined the potential for MBD analytics to tackle a broader set of global challenges in local settings in the long term.Would you be interested in learning more about mobile big data and Positium? Let's talk about what mobile big data can do to help your organisation make decisions based on population mobility.
.png)


